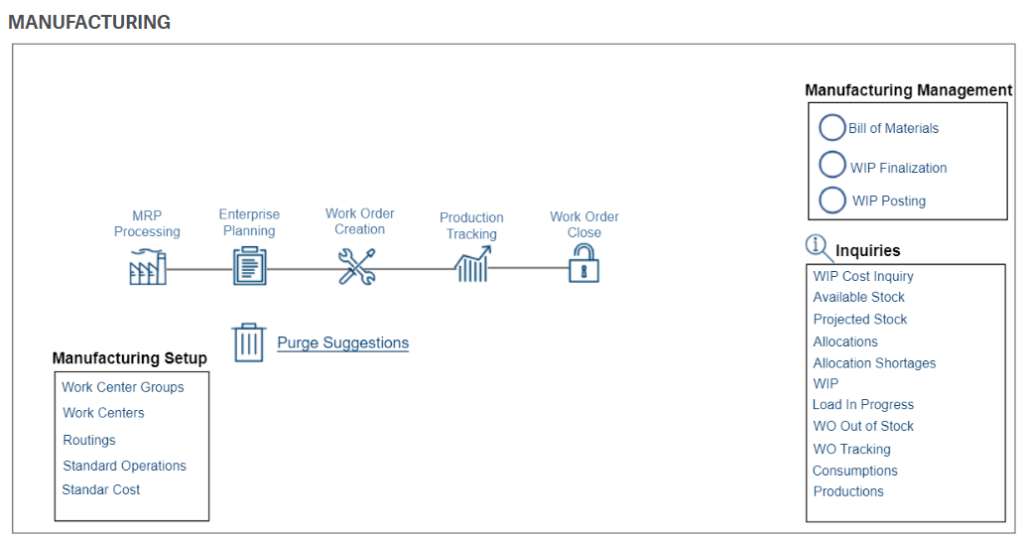
 Visual Process Maps in Sage X3

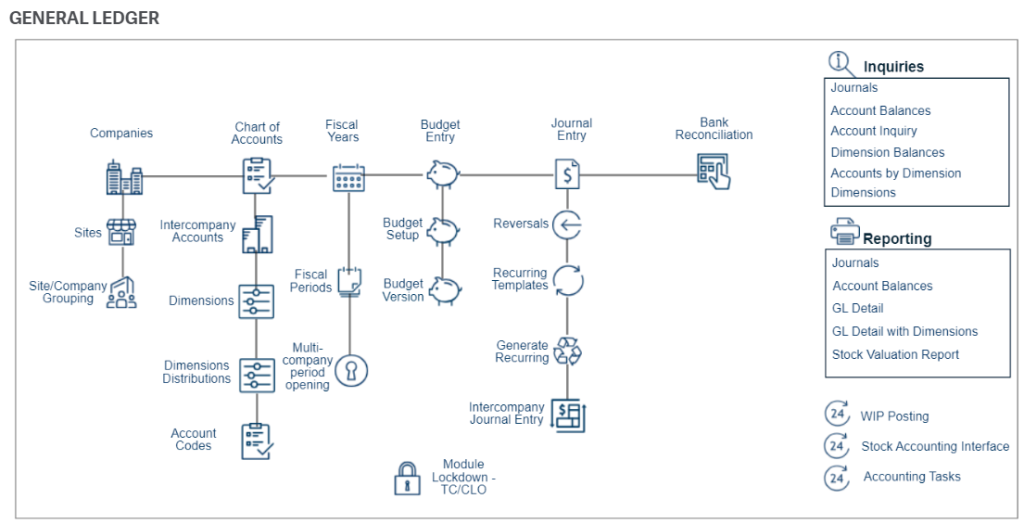
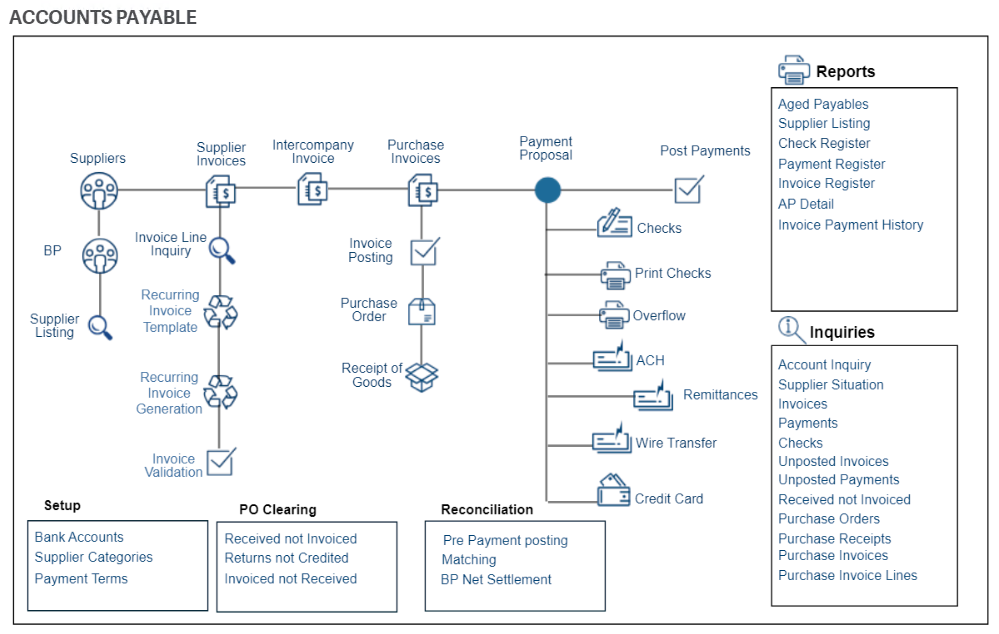
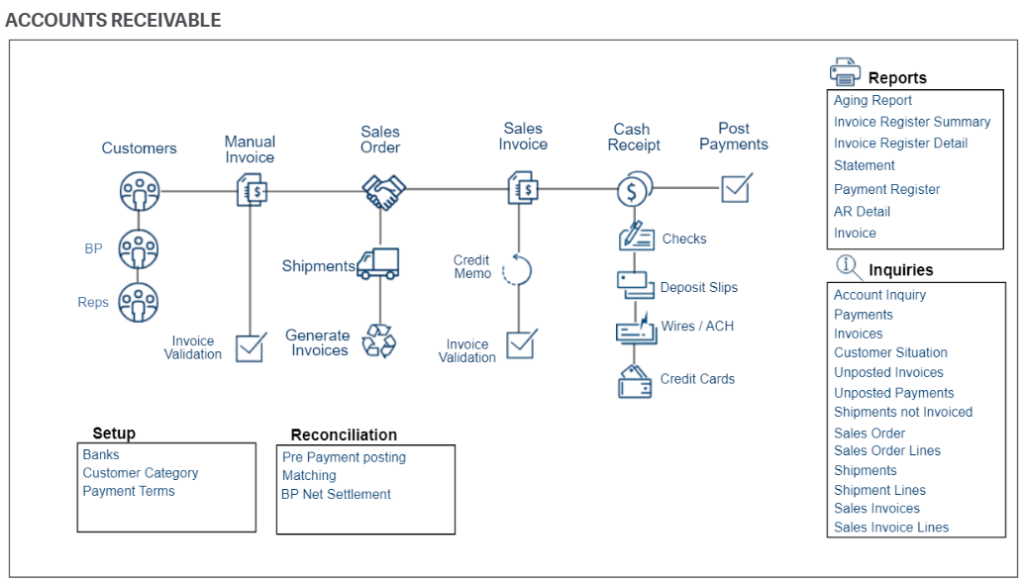
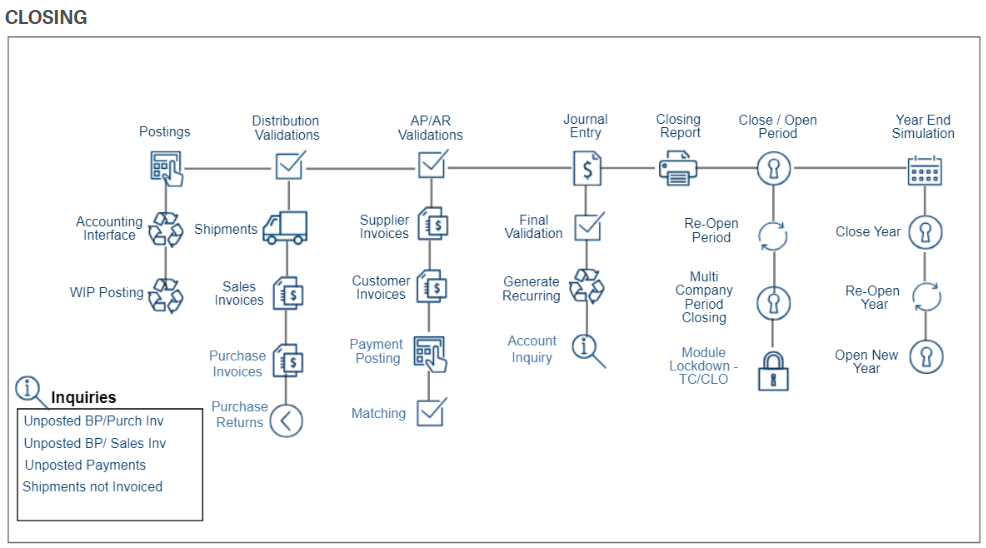
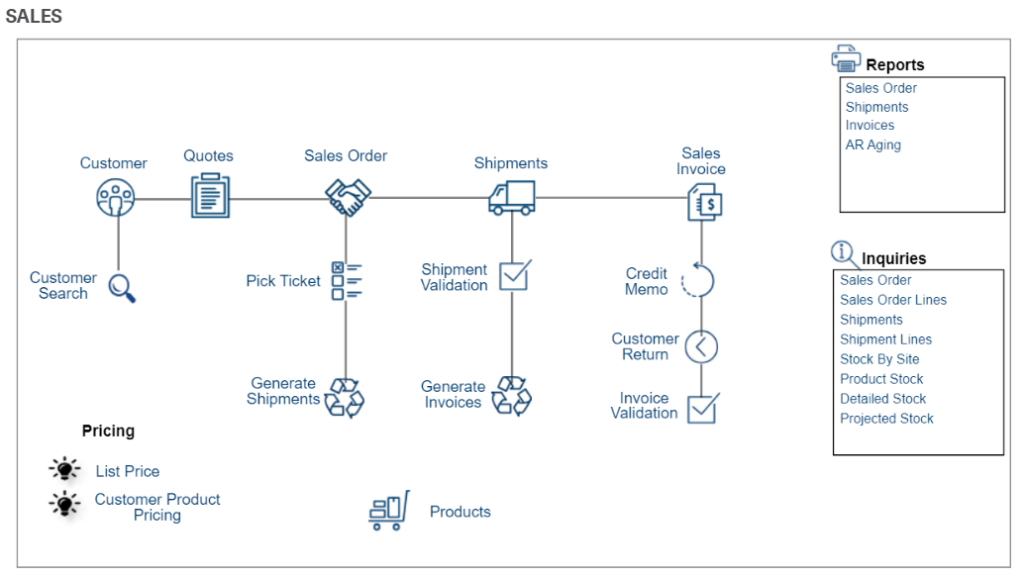
Visual Process Maps are visual representations of typical workflows in Sage X3. They make it easier to navigate through the application to the relevant functions and tasks (instead of relying on the extensive menus and lists of tasks).
While you can create your own process maps, Net at Work offers a number of pre-built, custom dashboards (see options below).
If you are interested in adding any of these dashboards to your system, please contact your Net at Work Account Manager or Team Manager. Once available in your system, the process maps can be further customized to better suit your individual business needs.
ADMINISTRATION PROCESS MAPS
OPTION 1
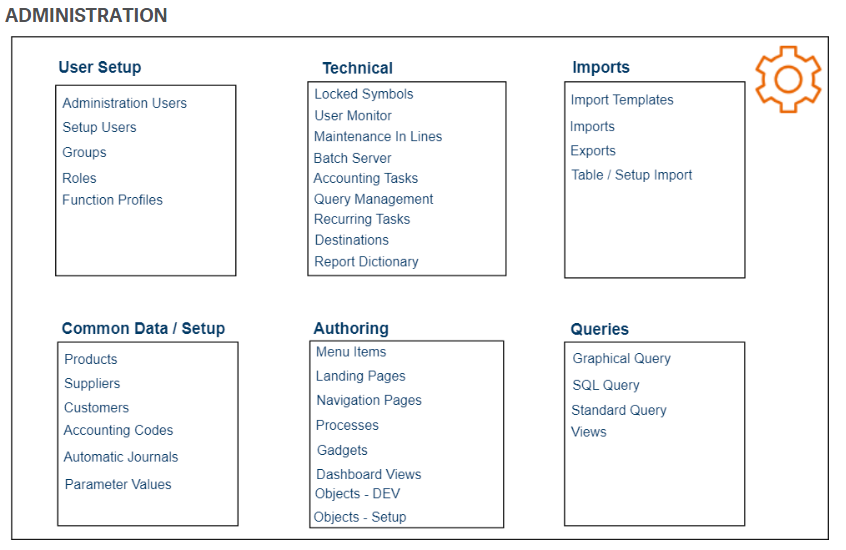
OPTION 2
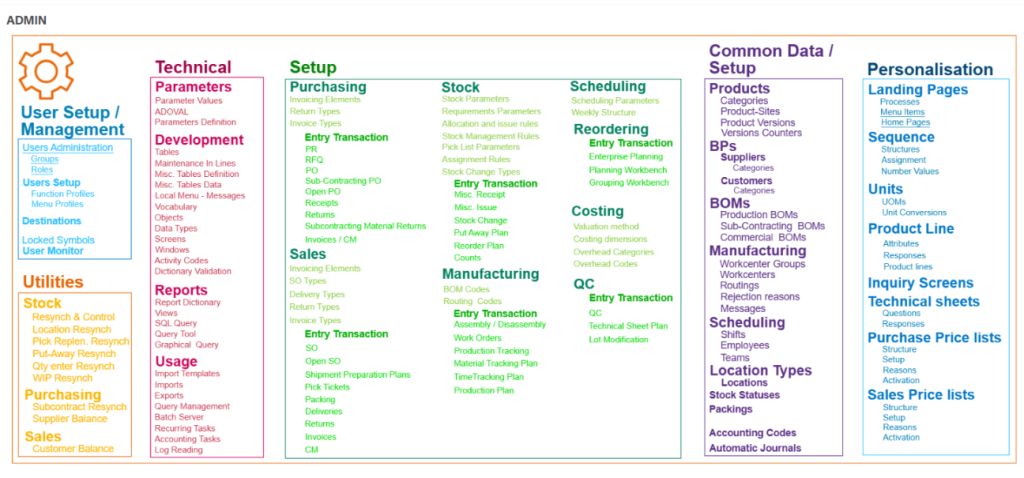
OPTION 3
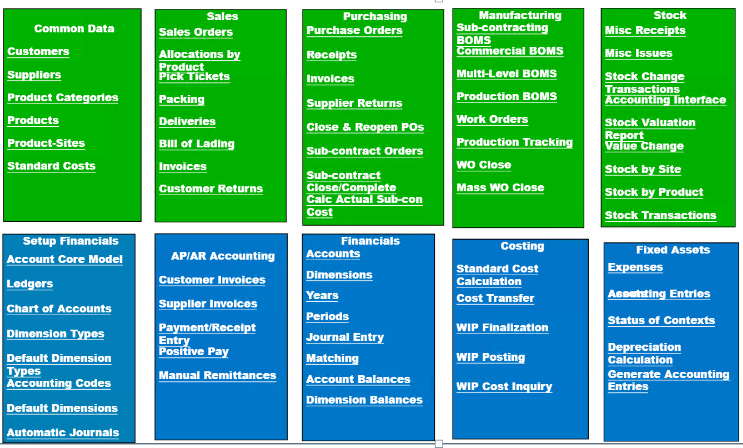
FINANCE PROCESS MAPS
GENERAL LEDGER
ACCOUNTS PAYABLE
ACCOUNTS RECEIVABLE
CLOSING
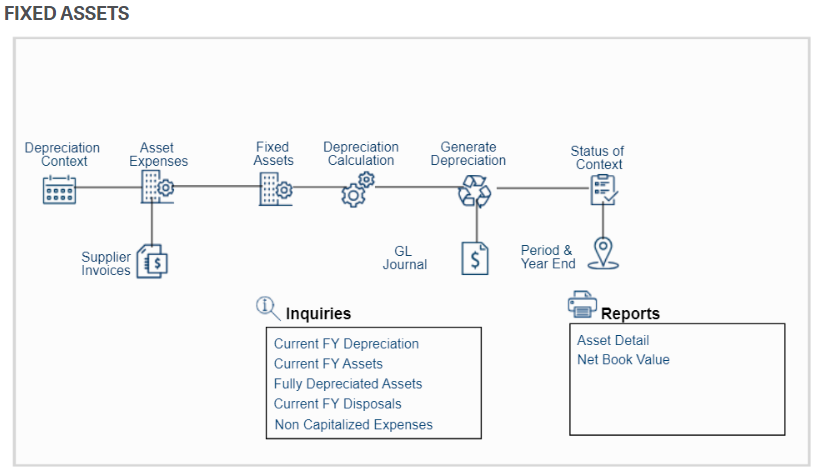
FIXED ASSETS
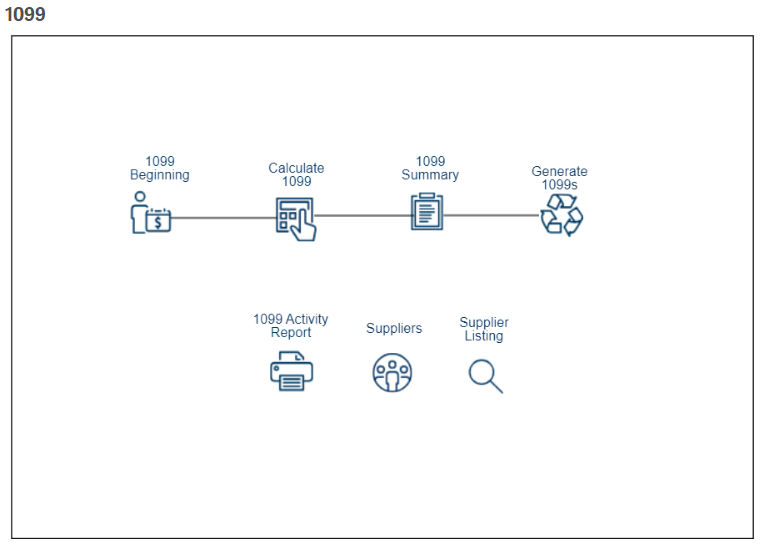
1099
OPERATIONS PROCESS MAPS
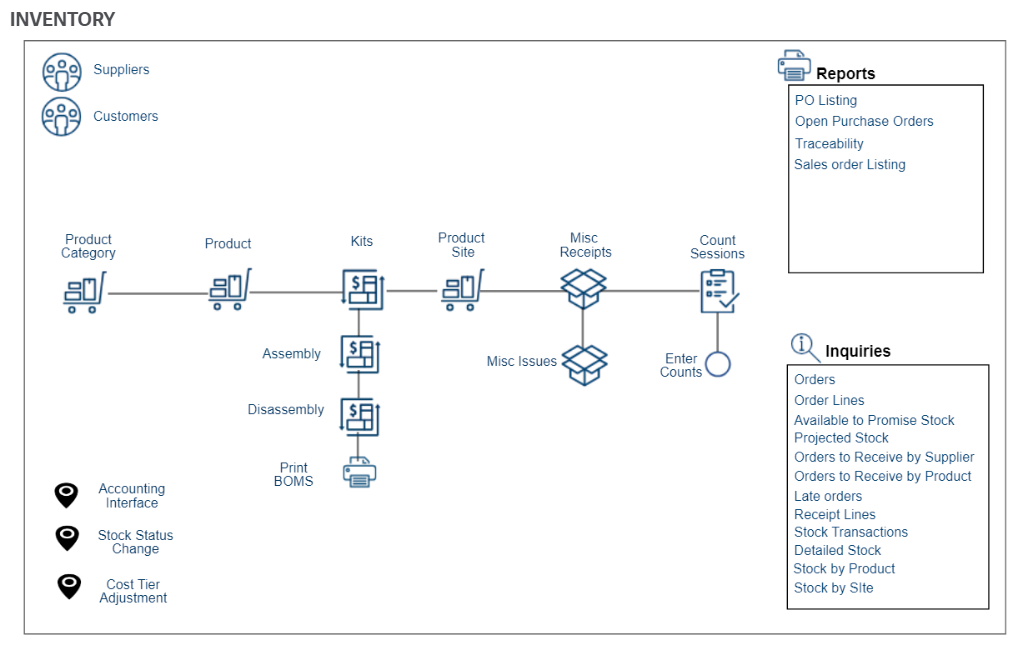
INVENTORY
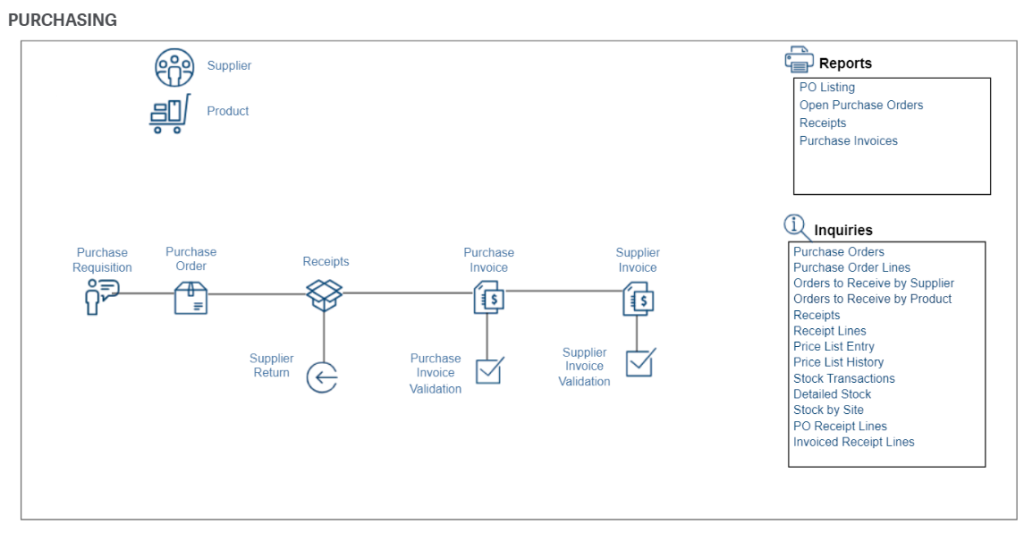
PURCHASING
SALES
MANUFACTURING
