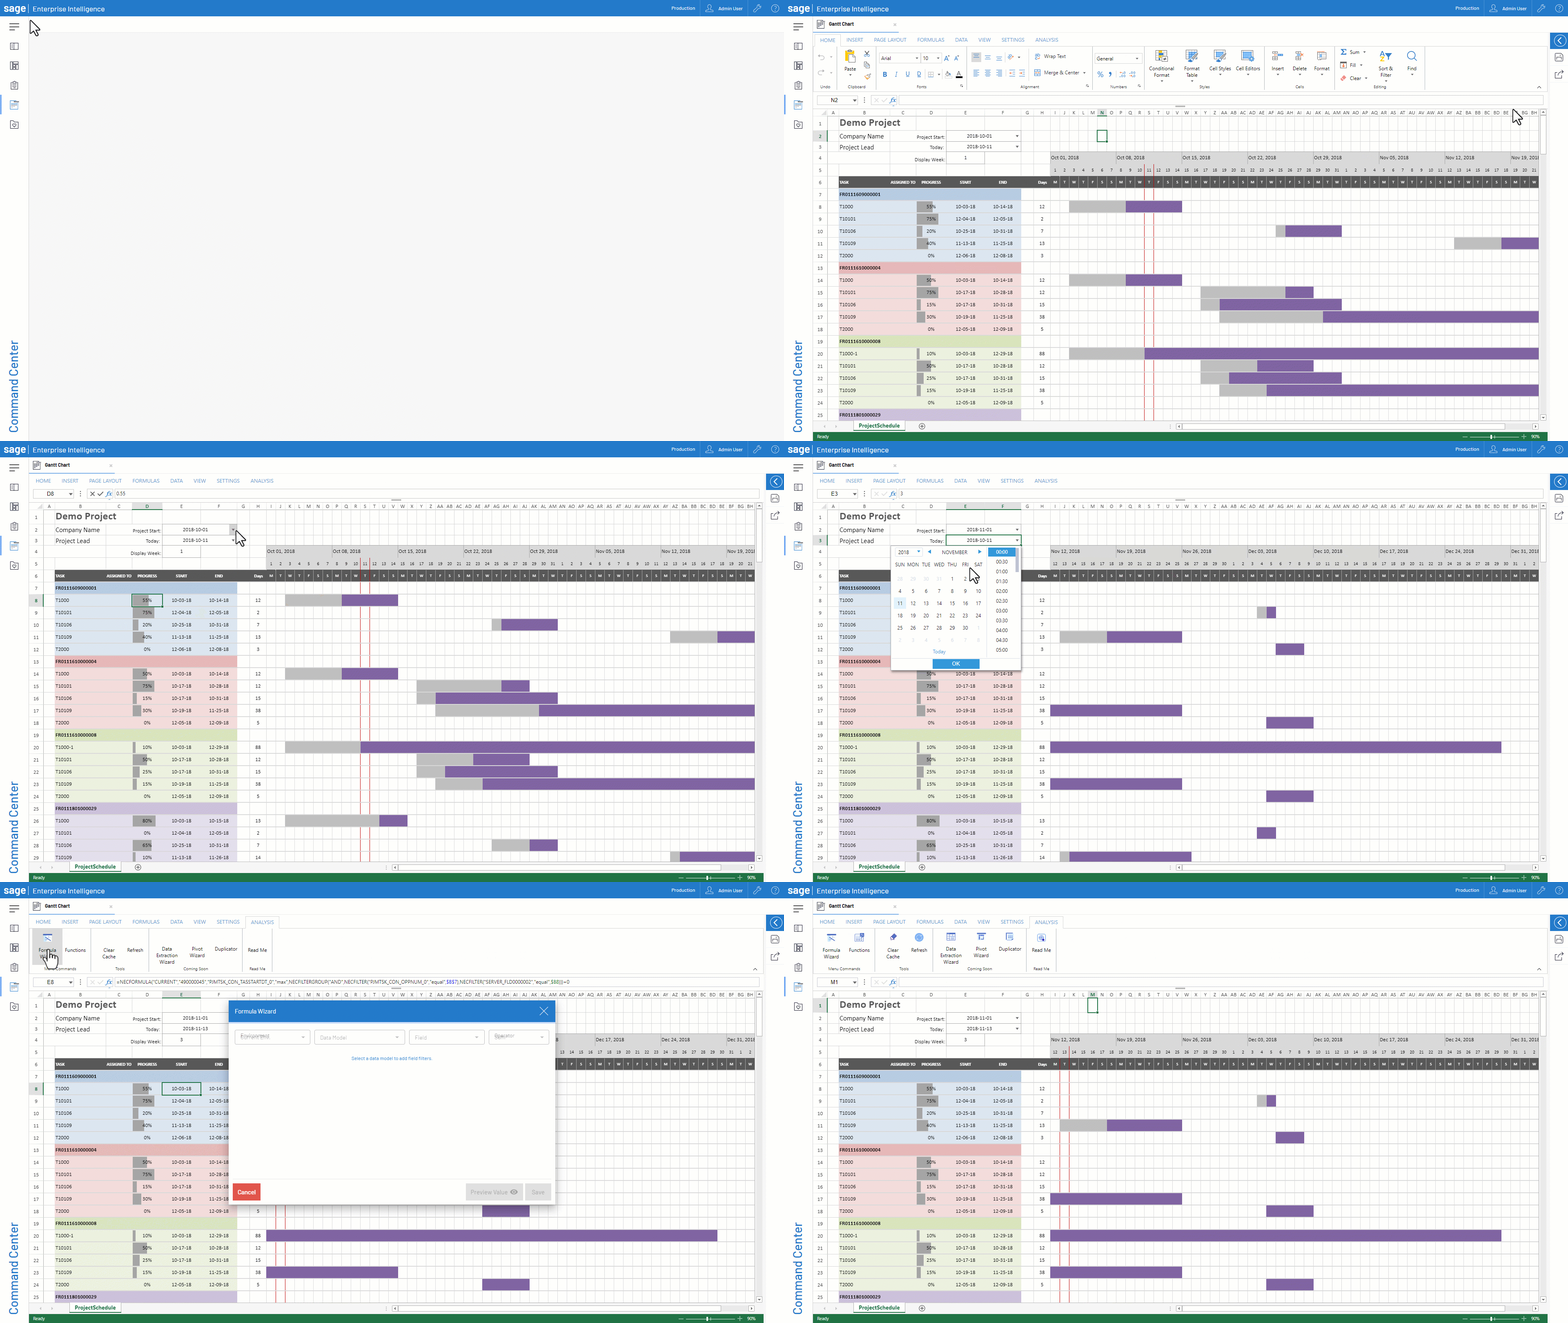
 Using the SEI Web Workbook to Create Dynamic Gantt Charts, Among Other Things

The all-new Sage Enterprise Intelligence (SEI) Web Workbook allows users to benefit from the familiar functionalities of Excel and the advanced reporting and analytic capabilities of SEI.
Optimized for Where You Work
Access your workbooks on any device without opening a second application. You can view your workbooks from your mobile phone and Mac computer and get all your analysis and reporting done in one place – SEI. Create your report, add images, export copies to Excel, or share with colleagues while maintaining your layout and user permissions.
See the SEI Web Workbook in Action
In this short video, we show how the SEI Web Workbook can be used to create a dynamic Gantt Chart to show one example of what you can build with this new feature. Here, the data is coming from the Sage X3 Project Management module but you can pull data from any source (on-prem or cloud).

Additional Resources
• SEI Web Workbook Feature Sheet
• Introducing the Web Workbook How-To Video
For more information on SEI’s new Web Workbook, please contact us.


