Sage 300 Newsletter – Q3 2021
Keeping You Up-To-Date With Information About Sage 300
Sage Data & Analytics for Sage 300: Customizable and Easy-to Use Reports & Data Visualizations
Sage Data and Analytics (SD&A) for Sage 300 comes in three Editions: Standard, Advanced & Premium
SD&A Standard gives you a full suite of pre-packaged, customizable and easy-to use reports and data visualizations, right out of the box. No programming or coding required!
All three version of SD&A are hosted and managed on Microsoft Azure, supported with in product maintenance and automated upgrades, and backed by their data security programs. Cloud-hosted and browser-based, SD&A is accessible on mobile, tablet or desktop.
Standard Edition
SD&A Standard features include:
Business Intelligence in-a-box allows you to visualize, interpret actionable data from your Sage 300 using SD&A’s extensive range of BI resources: reports, dashboards, statements, analytics, and more.
Automated data management quickly gathers data from your Sage 300 – including all your customizations – as well as all your other data sources: from your CRM to legacy databases, from Excel spreadsheets to your online analytics.
It offers SaaS flexibility, and you pay only for the data warehousing and features that you need with up to 10Gb of online storage for the portions of your financial data that support your reporting and analytical insights. Enjoy full functionality without the headaches of hardware, resourcing, or complex configurations.
Sage Data & Analytics: Standard Benefits
Instant insight Interactive sales dashboards, graphical cashflow analysis, detailed and trusted P&L reports. All of this and more is available right out of the box.
Access on-the-go mobile access through a responsive web application, optimized for any desktop or mobile device.
Here’s what’s included in SD&A’s Standard Edition: Auto-refreshed, cloud-based reporting with three pre-built modules:
- General Ledger
- Accounts Receivable
- Accounts Payable Ready-made, out-of-the-box analytics
- Six dashboards
- 11 reports
- 55 charts
- 75 KPIs Access for your team
- Five BI consumer (report reader) seats
- One BI designer (report author) seat Data from across your organization
- Cloud storage of up to 10GB active financial data
- Covering data from up to two companies
- With one scheduled refresh per day
All 3 editions of Sage Data & Analytics also include the following:
- Support for every Sage 300
- Automated company consolidation
- Friendly data model
- Incremental load support
- Data model
- Multi-Segment extraction
- Customizable General Ledger account mapping
- Support for Source account groups, types, and a Common Chart of accounts
- Customizable data security and governance Analytics
- Multi-company consolidation
- Collaborative platform
- Report distribution by email
The following Dashboards are included in the Standard Edition:
- Accounts Payable manager dashboard
- Accounts Receivable manager dashboard
- Chief Financial Officer dashboard
- Income Statement dashboard
- Cash Flow dashboard
- Expenses Analysis dashboard
- Statement of Profit or Loss
- Statement of Financial Position (Balance Sheet)
- Trial Balance
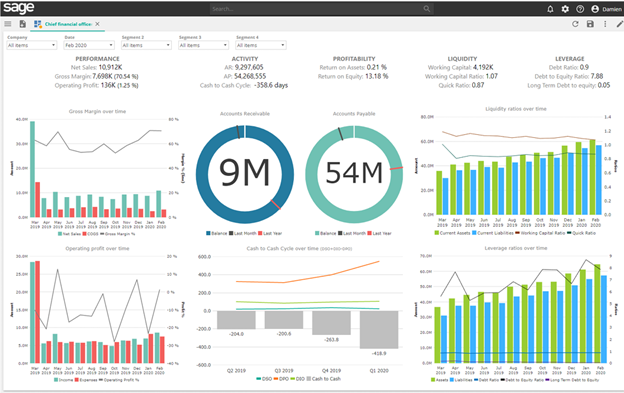
The Chief Financial Officer Dashboard includes the following:
- Performance card; Activity card
- Profitability card
- Liquidity card; Leverage card
- Gross Margin over time
- AR gauge, AP gauge
- Liquidity ratios over time
- Operating Profit over time
- Cash to Cash Cycle over time
- Profitability ratios over time
- Leverage ratios over time resources. Key metrics to get you started include:
- Gross margin
- Operating Profit; OP%
- Cash to Cash Cycle
- Return on Assets
- Return on Equity
- Working Capital
- Working Capital Ratio
- Quick Ratio; Debt Ratio
- Debt to Equity Ratio
- Long term Debt to Equity Ratio
- DSO, DIO, DPO)
Here is an example of the Chief Financial Officer Dashboard:

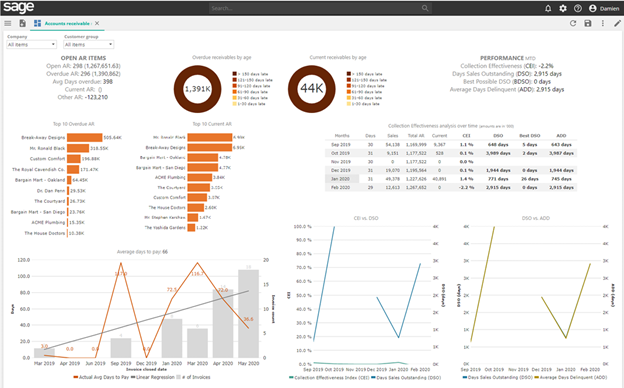
The Accounts Receivable Dashboard includes the following:
- Open AR items card
- Overdue receivables by age
- Current receivables by age
- Performance MTD card
- Top 10 overdue AR resources:
- Top 10 customers by overdue AR
- Top 10 current AR
- Top 10 customers by AR not past due
- Collection Effectiveness analysis over time • Average days to pay
- Collection Effectiveness Index (CEI) vs. Days Sales Outstanding (DSO)
- DSO vs Average Days Delinquent (ADD) Key metrics to get you started include:
- Avg Days overdue
- Avg days to pay
- Collection Effectiveness (CEI)
- Days Sales Outstanding (DSO)
- Best Possible DSO (BDSO)
- Average Days Delinquent
- Average Days Delinquent (ADD)
Here is an example of the Accounts Receivable Dashboard:

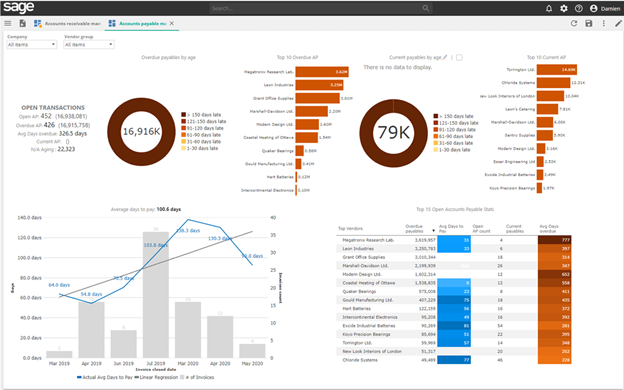
The Accounts Payable Dashboard includes the following:
- Open transactions card
- Overdue payables by age
- Top 10 overdue AP resources:
- Top 10 suppliers with largest overdue AP
- Current payables by age
- Top 10 current AP
- Key metrics to get you started include:
- Avg Days overdue
- Avg days to pay
- Avg amount / invoice Top 10 suppliers with largest AP balance not past due
- Average days to pay
- Top open accounts payable
- Top 15 overdue suppliers
Here is an example of the Accounts Payable Dashboard:

The Advanced Edition
In addition to everything that is in the Standard Edition, you also get Auto-refreshing of data and cloud-based reporting with all pre-built modules. Additionally, you get more dashboards, greater data storage, more companies for consolidations and additional user and designer licenses:
- General Ledger
- Accounts Receivable
- Accounts Payable
- Inventory
- Procurement
- Sales Ready-made, out-of-the-box analytics
- 13 dashboards
- 35 reports
- 105 charts
- 110 KPIs Access for your whole team
- 15 BI consumer (report reader) seats
- Two BI designer (report author) seats Data from across your organization
- Cloud storage of up to 55GB
- Covering data from up to five companies
- Refresh as many times per day within our Fair Use policy
- Help when you need it
- Maintenance and support
- Tailored courses on Sage University
- Easy, predictable billing
- A single annual fee
- Including hosting
The following dashboards are included in the Advanced Edition:

Premium Edition
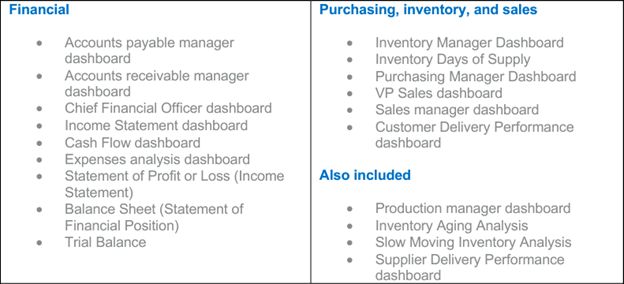
In addition to the Dashboards included in the Standard and Advanced Editions, Premium offers:
- Financial
- Accounts payable manager dashboard
- Accounts receivable manager dashboard
- Chief Financial Officer dashboard
- Income Statement dashboard
- Cash Flow dashboard
- Expense analysis dashboard
- Statement of Profit or Loss (Income Statement)
- Balance Sheet (Statement of Financial Position) Purchasing, inventory, and sales
- Inventory Manager Dashboard
- Inventory Days of Supply
- Purchasing Manager Dashboard
- VP Sales dashboard
- Sales manager dashboard
- Customer Delivery Performance dashboard
- Production manager dashboard
- Inventory Aging Analysis
- Trial Balance
- Slow Moving Inventory Analysis
- Supplier Delivery Performance dashboard
With the Premium Edition, you can create dashboard from your Sage 300 data and include data from other data sources. These additional data sources include data connectors for all the systems listed here, with more to come.
- ADO.NET
- Azure Data Management
- CSV
- DB2
- Excel Workbook
- Google Analytics
- HubSpot
- Informix
- Jira
- Magento
- Marketo
- Microsoft Dynamics 365 Business Central
- Microsoft Dynamics 365 Finance and Operations
- Microsoft Dynamics 365 for Sales
- Microsoft Dynamics AX
- Microsoft Dynamics CRM
- Microsoft Dynamics GP
- Microsoft Dynamics NAV
- MYOB AccountRight Live
- MySQL
- NetSuite
- OData
- ODBC
- Open Exchange Rates
- Oracle
- Oracle Sales Cloud
- PostgreSQL
- Quickbooks
- Reckon
- Sage 300
- Sage 500
- Sage Business Cloud People
- Sage HandiSoft
- Sage Intacct
- Sage Line 500
- Sage MicrOpay
- Sage X3 HR
- Salesforce
- Salesforce Marketing Cloud
- SAP Business One
- SQL Server
- SQLLite
- SYSPRO
- Teradata
- Toggl
- Xero
- XML
- Zendesk
To briefly summarize:
All editions of Sage Data & Analytics also include the following:
- Automated company consolidation
- Friendly data model
- Incremental load support
- Multi-Segment extraction
- Customizable General Ledger account mapping
- Support for Source account groups, types, and a Common Chart of accounts
- Customizable data security and governance Analytics
- Multi-company consolidation
- Collaborative platform
- Report distribution by email
Sage Data and Analytics (SD&A) brings together, with ease, all the dashboards that owners, C-level personnel and managers need to effectively run their day-to-day operations and make those critical decisions that will guide your business to success.


